Node.js Diagnostic Reports

Using the diagnostic reports feature of NiM is pretty straight forward. This tutorial will explain the steps assuming you're already a NiM user. If not, then you just need to install the NiM Chromium (any Chromium browser, not just Chrome) extension in your browser and you'll be ready to follow along.
Overview
In short, the steps will be as follows:
- Ensure NiM is installed and you have enabled the Node.js Diagnostic Reports feature.
- Login to Brakecode from the NiM DevTools panel.
- Use the NPM brakecode package to relay your reports.
Step 1
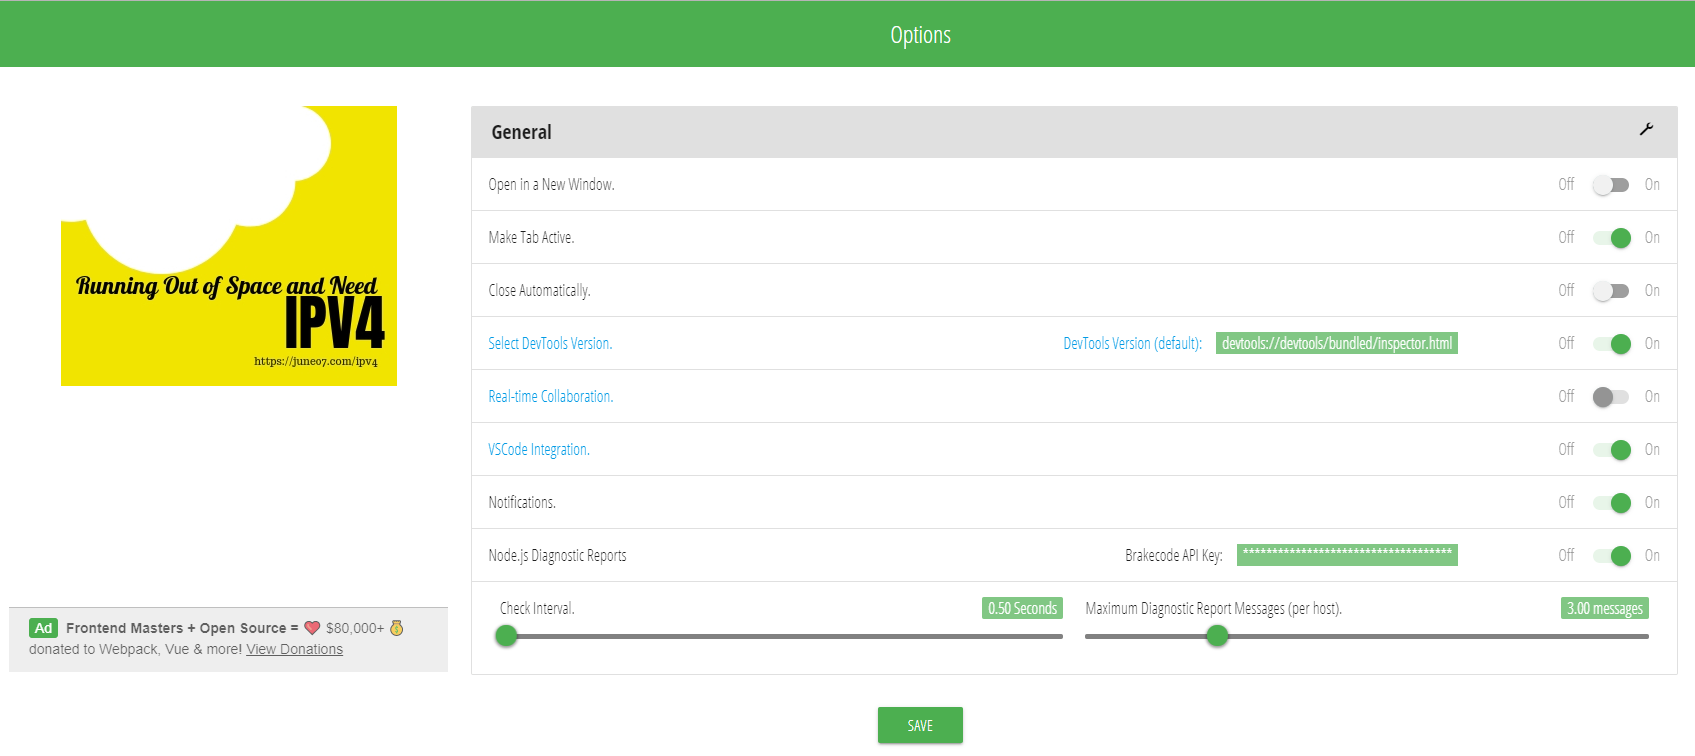
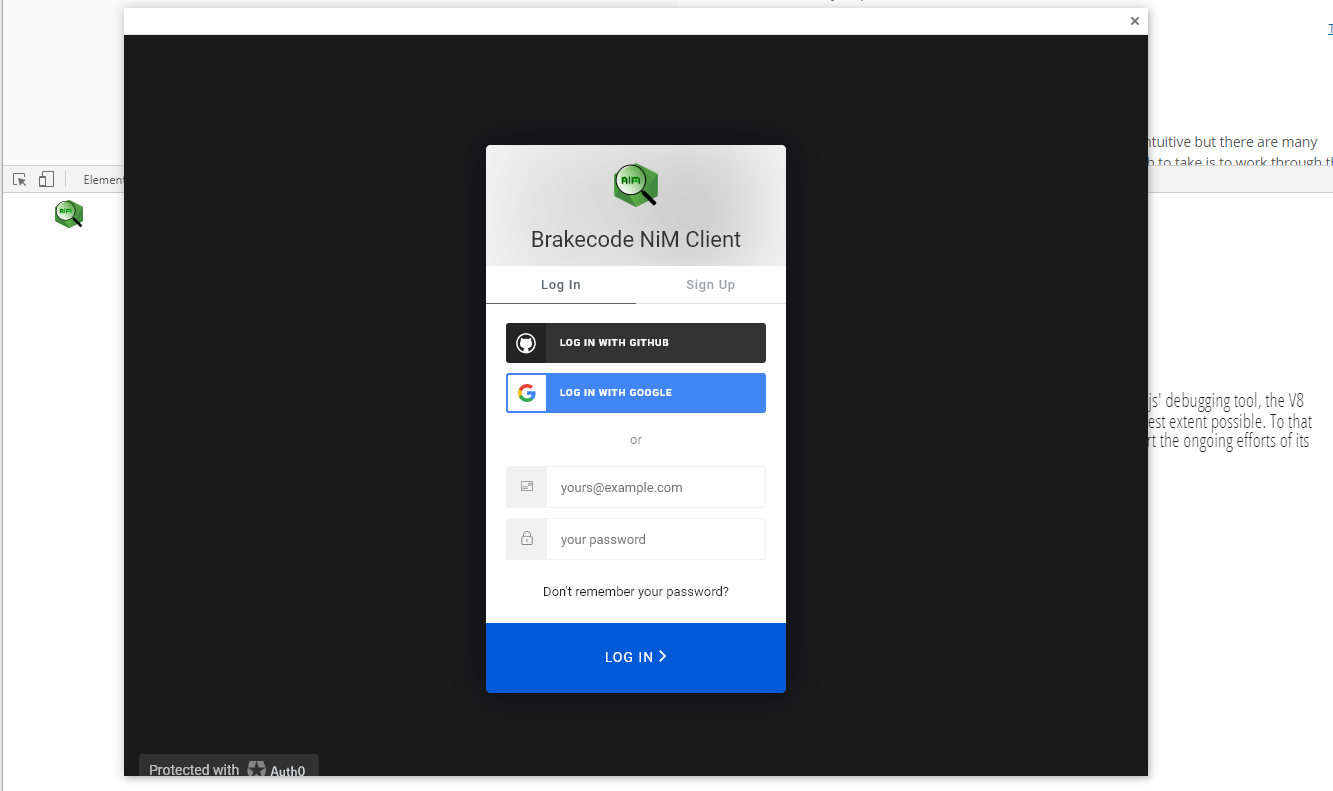
From the NiM Options page ensure that the Node.js Diagnostic Reports feature is enabled. You're Brakecode API Key will be available once you sign in to Brakecode.com in step 2.
Step 2
Step 3
Install the brakecode package from NPM (also available on GitHub).
npm install brakecode
require brakecode in your source file and call brakecode.sendReport(); which will also return the Node Diagnostic Report along with sending it fully encrypted to Brakecode.com where it will in turn be relayed to NiM.
brakecode = require('brakecode')();

let report = brakecode.sendReport();
Add your Brakecode API Key to environment by adding to .env or including on the command line like such BRAKECODE_API_KEY=832c43a2-6c1e-4867-b0c4-f39f27abbe3e node --experimental-report hello.js Also note that as diagnostic reports are still experimental in Node, you MUST use the --experimental-report flag.
node --experimental-report test.js

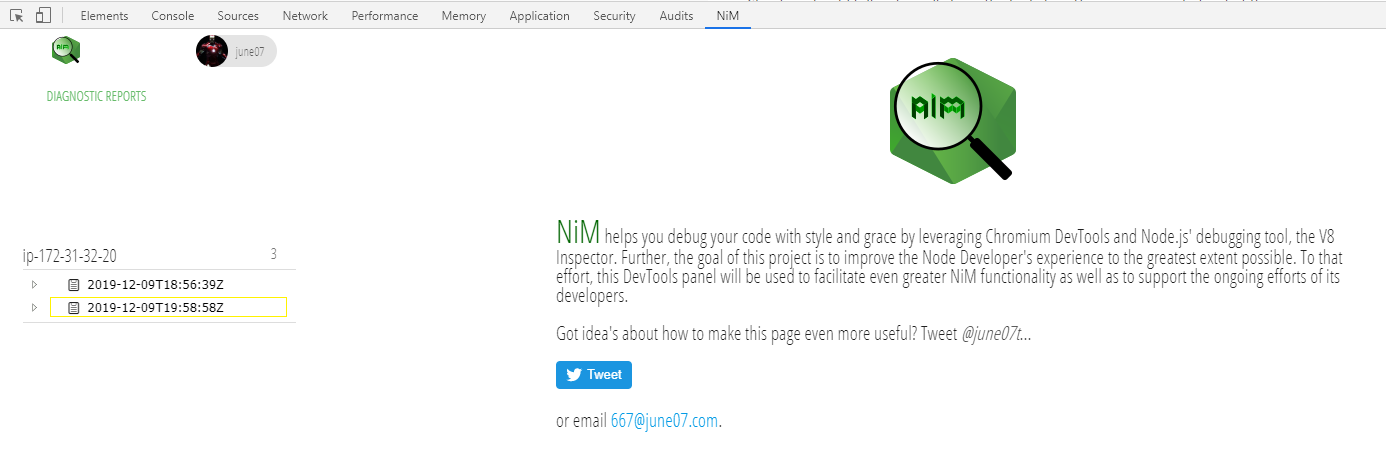
Now if you go back to your NiM client, you should see the report showing up under the same host where you ran your Node program, in our case it's an EC2 host with the IP 172.31.32.20.