
Deno Debugging with DevTools

I know it's Deno, not Dino, but it's a nice picture anyway and I'm sure you get the point. Deno is similar to Node. In fact cut them each in half, swap the two sides, and you get the other. That similarity follows when it comes to debugging. They both support the V8 Inspector Protocol and thus can both be debugged with tools that support the protocol including BrakeCODE This post will focus on Deno more than Node.
ChromIUM DevTools
Notice I emphasized the ium (and dropped the e). That's because DevTools is part of every Chromium browser of which there are many, the majority I would say, and not just the Google owned ChromE. BrakeCODE on the other hand is a standalone tool that leverages the strengths of DevTools, adding even more of it's own including certificate based SSH tunneling of V8 Inspector Protocol web sockets. Unlike using about://inspect which uses whatever version of DevTools that ships with the version of the Chromium browser one might be using, BrakeCODE uses web hosted versions of DevTools. There are advantages to this approach.
Additional Components
In addition to the web UI, BrakeCODE is comprised of an open source agent that runs alongside your Deno/Node (other V8 runtimes...) applications. The apps can be running on "bare metal" (I use that term loosely in today's cloud based world) or inside of Docker containers (k8s isn't ready for this yet... lol). The Chromium browser extension NiM is also going to be used.
First Steps
This post assumes you already have Deno installed which is pretty straight forward. Just as with Node, Deno uses the --inspect and --inspect-brk runtime flags which cause the V8 inspector to be started. So in addition to installing Deno, you'll also want to install brakecode with npm install -g brakecode. Another option would be to use npx to run brakecode. You will need a BrakeCODE api key which is easily attained by going to https://brakecode.com and creating a free account. Finally you'll want to start your Deno application with either inspect flags set and as well start the BrakeCODE agent. The agent will ask for your api key the first time it is run and will be saved under the ~/.brakecode sub directory for future use.
Running
The agent will log to stdout and show which deno/node processes were detected as well as if they were detected inside of a Docker container or not. Further the agent will automatically have generated a SSH keypair and certificate used to authenticate to the BrakeCODE backend servers in order to tunnel your V8 Debugger Protocol web sockets, making them available from the dashboard and associated clients (NiM in our example case). At this point all source code is available in the BrakeCODE UI and/or via NiM.
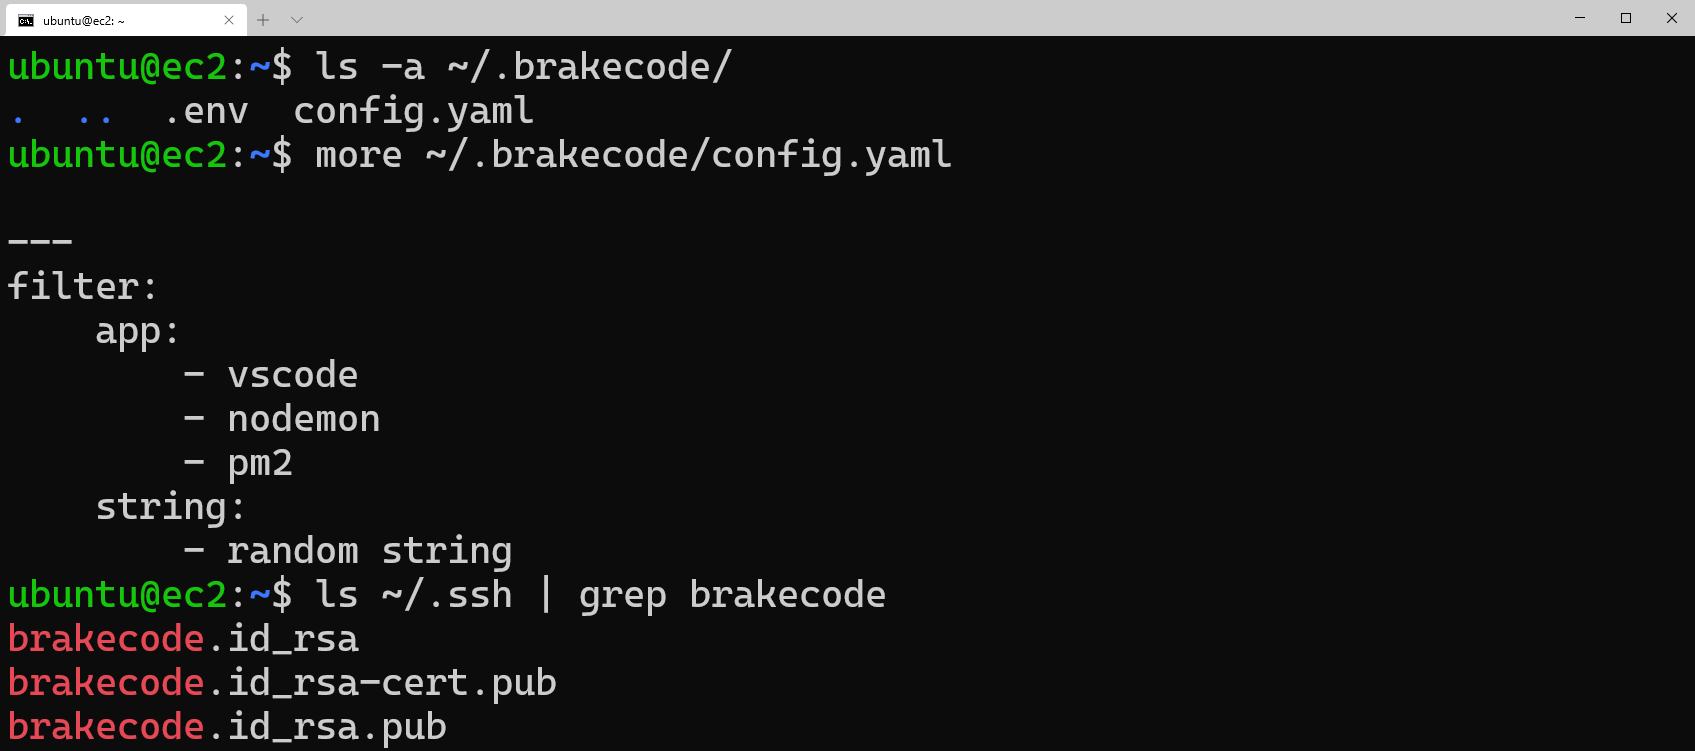
The generated keypair and public certificate are saved under the home directory of the user that started the agent. Additionally, the agent uses config.yaml and has a default filter setup to exclude processes specific to the apps listed, in this case vscode, nodemon, and pm2. So by default the agent will ignore the parent process since it's unlikely that you want to debug them but rather your app.
Finally you can see the .env file is listed and this is where your api key is stored.
Brakepoints, Stepping, etc.
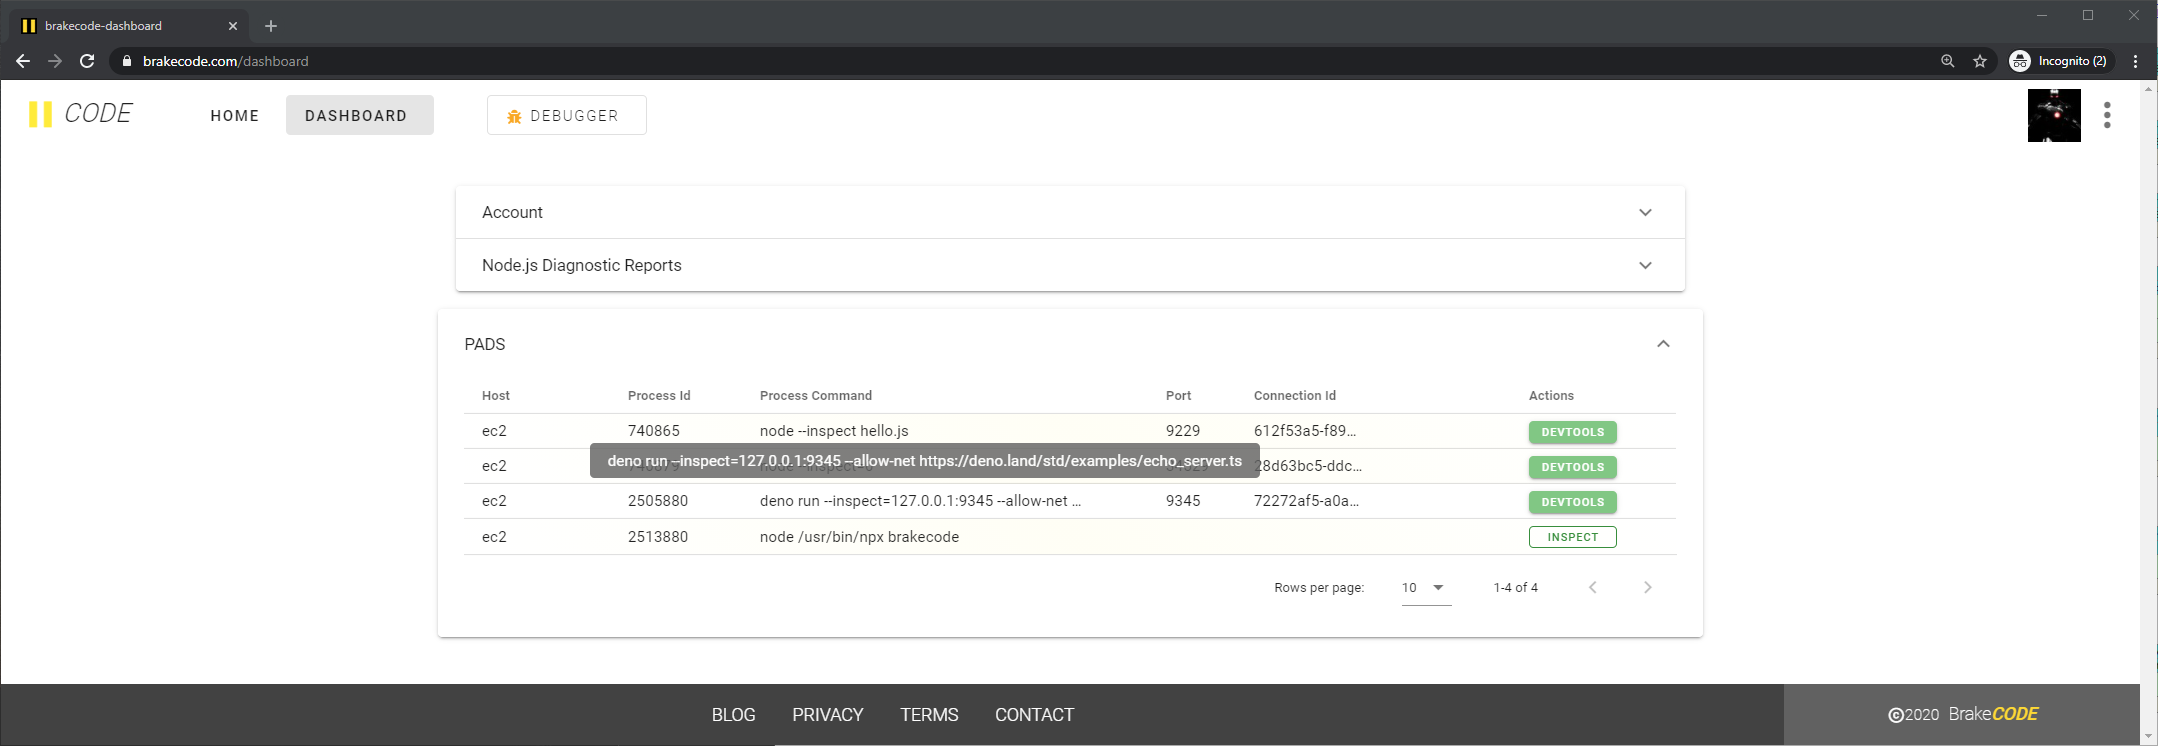
You'll notice the UI is rich with information about the V8 processes which are running, including the host, V8 inspect protocol server port, process id, name, and other command line information. Further you can inspect the process by clicking the DevTools button under the actions column.

Clicking the DevTools button will open a debugger session and cause the UI to switch to the BrakeCODE debugger where you will find the session. If you've used --inspect-brk you should notice that DevTools has paused execution. Otherwise as shown here since we used --inspect execution is underway and the familiar DevTools interface is seen.
Of course Deno is different from Node in that source files are written in TypeScript and not plain JavaScript. Thus, you will notice duplicate entries for each source file, the plain font version being the compiled source file and the italics version being the source map file.
Adding breakpoints in the DevTools interface will open up the source map file which allows stepping through the source code.
Additional Features
In addition to using the BrakeCODE debugger UI directly (Ctrl+Click), you have the option of opening debug sessions directly in the browser which will still use the hosted DevTools endpoint, however will be in an entirely separated browser tab/window. Further NiM will detect and pick up this sessions in it's UI as well as give the additional ability to use the DevTools instance local to the browser (i.e. the devtools:// endpoint).
Conclusion
As we've shown Debugging Deno/Node with DevTools is pretty easy with the right tool like BrakeCODE. Further securely debugging remote instances is a piece of cake when you offload the SSH tunneling and session management, while focusing on your code. BrakeCODE makes all of the necessary information available to you in it's straightforward UI. Install the agent and give it a try yourself.